![]() Document published by the EUROPEAN
COMMISSION, Directorate - General XIII, Telecommunications, Information
Market and Exploitation of Research, L-2920 Luxembourg.
Document published by the EUROPEAN
COMMISSION, Directorate - General XIII, Telecommunications, Information
Market and Exploitation of Research, L-2920 Luxembourg.
Catalogue: CL-NA-16095-EN-C
LEGAL NOTICE: neither the European Commission nor any person acting on behalf of the Commission is responsible for the use which might be made of the following information.
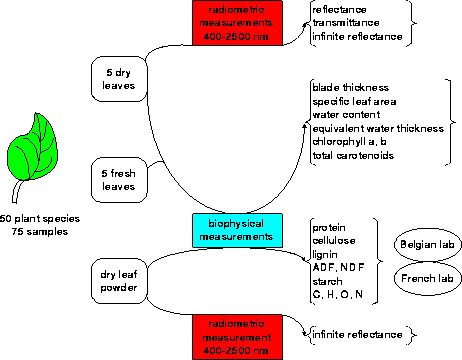
An experiment was organized in the Joint Research Centre at Ispra during the summer of 1993 in which a data set associating visible / infrared spectra of vegetation elements (leaves, conifer needles, stems, etc) with physical measurements and biochemical analyses was constructed. This document describes how the experiment was performed and how the main results have been classified and archived.
The estimation of leaf biochemistry and leaf water status with remote sensing data is a challenge for the years to come. It also has an important potential in agriculture to follow crop development and yield predictions. The biochemical constituents of interest in this experiment were lignin, proteins (nitrogen), cellulose and starch, as well as chlorophyll and foliar water. The major processes involved in the terrestrial ecosystem such as photosynthesis, primary production, or foliar decomposition can be related to these constituents. As leaves are the most important surfaces of a plant canopy, relating their optical properties to these constituents is a priority. The overall objective of the experiment was to investigate the use of high resolution visible and near infrared reflectance spectroscopy for the retrieval of chlorophylls, water, protein, cellulose, lignin, and starch both on fresh and dry material, on individual leaves and on optically thick samples (stacked leaves + needles or powders).
In order to have a wide range of variation of leaf internal structure, pigmentation, water content and biochemical components, plant species with different types of leaves were collected during two separate periods during the summer of 1993. Many species were sampled twice (once in early summer, once in early autumn) in order to assess the variability in time of the biochemical composition. For particular species like maize which is the main crop in the region, plants at several stages of the growing cycle were collected. About 70 leaf samples representative of more than 50 species of woody and herbaceous plants (4 Gymnosperms, 9 Monocotyledons, and 37 Dicotyledons) were obtained from trees, crops and plants in the area of the JRC (Table 1).
# English Italiano Francais Latinus First experiment 1 d Clover Trifoglio Trefle Trifolium pratense 2 m Sorghetta Sorghetta Sorghetta Sorghum halepense 3 g Norway spruce 91 Abete rosso 91 Epicea 91 Picea abies 4 d Wild vine (1/2) Vite selvatica Vigne sauvage Vitis silvestris 5 d Ash (1/2) Frassino europeo Frene Fraxinus excelsior 6 d Lettuce Lattuga romana Laitue Lactuca sativa 7 g Douglas fir 93 Abete di Douglas 93 Pin Douglas 93 Pseudotsuga menziesii 8 d Laurel ceraso old Lauroceraso vecchio Laurier ceraso vieux Prunus laurocerasus 9 g Norway spruce 92 Abete rosso 92 Epicea 92 Picea abies 10 d Poplar (1/3) Pioppo canadese Peuplier Populus canadensis 11 d Alfalfa Erba medica Luzerne Medicago sativa 12 m Maize 1 Mais 1 Mais 1 Zea mays 13 d Potato Patata Pomme de terre Solanum tuberosum 14 d Wild vine (2/2) Vite selvatica Vigne sauvage Vitis silvestris 15 d Ash (2/2) Frassino europeo Frene Fraxinus excelsior 16 m Maize 3 (1/2) Mais 3 Mais 3 Zea mays 17 g Contorta pine Pino contorto Pin contortas Pinus contorta 18 * Cultivated mushroom Fungo coltivato Champignon de Paris Psalliota hortensis 19 d Laurel ceraso young Lauroceraso giovane Laurier ceraso jeune Prunus laurocerasus 20 d Beech (1/2) Faggio comune Hetre Fagus sylvatica 21 d Laurel nobilis old (1/2) Lauro alloro vecchio Laurier nobilis vieux Laurus nobilis 22 d False acacia (1/2) Robinia Robinier Robinia pseudoacacia 23 d Oak (1/2) Roverella Chene Quercus pubescens 24 d Sunflower Girasole Tournesol Helianthus annuus 25 d Linden Tiglio europeo Tilleul Tilia europaea 26 m Maize 3 (2/2) Mais 3 Mais 3 Zea mays 27 d Walnut (no stem) Noce (senza nervatura) Noyer (sans nervure) Juglans regia 28 d Walnut Noce Noyer Juglans regia 29 d Poplar (2/3) Pioppo canadese Peuplier Populus canadensis 30 d Beech (2/2) Faggio comune Hetre Fagus sylvatica 31 d Laurel nobilis old (2/2) Lauro alloro vecchio Laurier nobilis vieux Laurus nobilis 32 d False acacia (2/2) Robinia Robinier Robinia pseudoacacia 33 d Oak (2/2) Roverella Chene Quercus pubescens 34 m Stalks of maize 2 Steli di mais 2 Tiges de mais 2 Zea mays 35 d Alfalfa stalks Steli di erba medica Tiges de luzerne Medicago sativa 36 d Sugar beet (1/2) Barbabietola Betterave Beta vulgaris 37 d Nettles Ortica Ortie Urtica dioica 38 g Norway spruce 93 Abete rosso 93 Epicea 93 Picea abies 39 d Poplar (3/3) Pioppo canadese Peuplier Populus canadensis 40 m Rice (1/2) Riso Riz Oryza sativa 41 m Phleum pratense Coda di topo Phleum pratense Phleum pratense 42 m Rye ear (1/2) Spiga di segale Epi de seigle Secale cereale 43 m Ear of salmone wheat (1/2) Spiga di frumento Epi de ble Triticum aestivum 44 m Ear of pandas wheat (1/2) Spiga di frumento Epi de ble Triticum aestivum 45 d Soya Soia Soja Soja hispida 46 d Sugar beet (2/2) Barbabietola Betterave Beta vulgaris 47 m Ear of pandas wheat (2/2) Spiga di frumento Epi de ble Triticum aestivum 48 m Ear of salmone wheat (2/2) Spiga di frumento Epi de ble Triticum aestivum 49 m Rye ear (2/2) Spiga di segale Epi de seigle Secale cereale 50 m Rice (2/2) Riso Riz Oryza sativa 51 d Maple (1/2) Acero Erable Acer pseudoplatanus 52 d Maple (2/2) Acero Erable Acer pseudoplatanus 53 d Sunflower stalks Steli di girasole Tiges de tournesol Helianthus annuus 54 d Apricot tree Albicocco Abricotier Armeniaca vulgaris 55 d Mulberry tree (1/2) Gelso Murier Morus nigra 56 d Plane bark Corteccia di platano Ecorce de platane Platanus acerifolia 57 d Mulberry tree (2/2) Gelso Murier Morus nigra 58 m Maize 2 Mais 2 Mais 2 Zea mays 59 d Chestnut Castagno Chataignier Castanea sativa 60 d Hazel tree (1/2) Nocciuolo Noisetier Corylus avellana 61 * Wood shavings Segatura Sciure de bois * 62 d Hazel tree (2/2) Nocciuolo Noisetier Corylus avellana 63 d Soya lecithin Lecitina di soia Lecithine de soja * 64 * Ecofoam (maize) Ecofoam (mais) Ecofoam (mais) * 65 * Cotton wool Cotone idrofilo Coton hydrophile * 66 * Potato starch Amido di patate Amidon de pdt * 67 * Rice starch Amido di riso Amidon de riz * 68 * Maize starch Amido di mais Amidon de mais * 69 * Wheat starch Amido di frumento Amidon de ble * 70 * Wheat bran Crusca di frumento Son de ble * Second experiment 71 d Linden Tiglio europeo Tilleul Tilia europaea 72 g Contorta pine Pino contorto Pin contortas Pinus contorta 73 d Poplar Pioppo europeo Peuplier Populus tremula 74 g Douglas fir 93 Abete di Douglas 93 Pin Douglas 93 Pseudotsuga menziesii 75 d Oak Roverella Chene Quercus pubescens 76 d Alder Ontano comune Aulne Alnus glutinosa 77 m Maize (1/2) Mais Mais Zea mays 78 m Maize dry Mais secco Mais sec Zea mays 79 d Red oak (1/2) Quercia rossa Chene rouge Quercus rubra 80 m Maize (2/2) Mais Mais Zea mays 81 m Maize half dry Mais Mais deseche Zea mays 82 d Red oak (2/2) Quercia rossa Chene rouge Quercus rubra 83 d Hazel tree Nocciuolo Noisetier Corylus avellana 84 d Chestnut dry Castagno secco Chataignier sec Castanea sativa 85 d Maple Acero Erable Acer pseudoplatanus 86 d Sage Salvia Sauge Salvia officinalis 87 d Fig tree Fico comune Figuier Ficus carica 88 m Bamboo 1 Bambo 1 Bambou 1 Bambusa acundinacea 89 m Palm tree Palma Palmier Chamaerops humilis 90 m Lake reed Cannuccia di palude Roseau Phragmites communis 91 m Bamboo 2 Bambo 2 Bambou 2 Bambusa acundinacea 92 d Apricot tree Albicocco Abricotier Armeniaca vulgaris 93 d Elm Olmo montano Orme Ulmus glabra 94 d Ivy Edera Lierre Hedera helix 95 m Maize stalks Steli di mais Tiges de Mais Zea mays 96 g Norway spruce 93 Abete rosso 93 Epicea 93 Picea abies 97 d False acacia Robinia Robinier Robinia pseudoacacia 98 d Prunus serotina Ciliegio nero Prunier Prunus serotina 99 d Ash Frassino europeo Frene Fraxinus excelsior 100 d Cabbage Cavolo verza Chou Brassica oleracea 101 g Bhutan pine Pino himalaiano Pin Pinus wallichiana 102 m Iris Iris Iris Iris germanica 103 d Vine (white grapes) Vite (uva bianca) Vigne (raisins blanc) Vitis vinifera 104 d Mulberry Gelso bianco Murier Morus alba 105 d Willow Salice Saule Salix alba 106 d Vine (american) Vite (americana) Vigne (americaine) Vitis silvestris 107 m Banana tree Banano Bananier Musa ensete 108 g Norway spruce 92 Abete Rosso 92 Epicea 92 Picea abies 109 d Alfalfa stalks Steli di erba medica Tiges de luzerne Medicago sativa 110 m Rice stalks Steli di riso Tiges de riz Oryza sativa 111 d Chestnut tree Castagno Chataignier Castanea sativa 112 d Birch Betulla Bouleau Betula alba 113 d Alfalfa Erba medica Luzerne Medicago sativa 114 d Tomato Pomodoro Tomate Lycopersicon esculentum 115 d Soya Soia Soja Soja hispida 116 m Rice Riso Riz Oryza sativa 117 * Rice (whole grain) Riso (con glumi) Riz (avec glumes) * 118 * Rice (husks) Riso (glumi) Riz (glumes) * 119 * Rice (whole grain) Riso (integrale) Riz (entier) * 120 * Rice parboiled Riso bianco Riz blanc * |
In addition, various substances such as powdered starch or proteins and vegetative material such as stems or bark were also included in the data set to increase its variability. About 800 g of leaves were required for each sample which normally yielded about 80 g of dry material.
A Perkin Elmer Lambda 19 double-beam spectrophotometer equipped with a BaSO4 integrating sphere was used for the measurement of the reflectance (R) and transmittance (T) of the upper faces of leaves, the probe light beam of the instrument being incident on the upper face of the leaves with an angle of 8°. The absorptance (A) was derived from R and T through the simple relationship: A=1*(R+T). In addition, the reflectance of optically thick samples (Ri) was measured by stacking leaves in order to magnify the radiometric signal and minimize the leaf to leaf variability or, in the case of needles or powders, by placing them in a quartz cuvette. Spectra were scanned over the 400-2500 nm wavelength interval with 1 nm step starting at 2500 nm and ending at 400 nm. The spectral resolution varied from 1 to 2 nm in the visible / near infrared (400-1000 nm) and from 4 to 5 nm in the middle infrared (1000-2500 nm). The calibration of the instrument was performed using Spectralon reflectance and wavelength calibration standards. For each sample, measurements were made on 5 different areas in order to quantify the small but not negligible leaf to leaf variability. The scan time required for each sample was about 4 minutes. In the case of needles and powdered material, the quartz cuvette was positioned vertically against the side of the BaSO4 integrating sphere. The reflectance spectra made in this mode have been corrected for the effect of the quartz plate in front of the sample taking into account the reflectance and transmittance of a single quartz plate of the same thickness, as described below. All the above procedure was repeated some days later on dried leaves and needles to analyse the influence of water which is known to obscure the biochemical information in the middle infrared region.
The integrating sphere is 60 mm in diameter with a ratio aperture / internal surface of 8%. In the VIS / NIR, the detector is a photomultiplier; in the IR region, a PbS detector is used. The transition between the two detectors occurs at 860.8 nm. First the full scale was set by running the instrument with two white diffusing reflectors positioned on the sample and reference ports of the sphere. The instrument stores this measurement and uses it to automatically correct the following measurements. The diffusing reflectors should be calibrated standards; however, at the time of the experiment, these were not available and two uncalibrated spectralon samples (sample A on the sample port, sample B on the reference port) were used. The reflectance of these two samples was later measured with reference to a SR99 diffuse reflectance standard. Let rB be the measured ratio of sample B to SR99 standard reflectances (rB=RB/RSR99). A background measurement was also performed by positioning a light trap (reflectance < 10-4) on the sample port. The apparent measured background reflectance (r0) has its origin in the small fraction of the sample beam not incident on the light trap but on the surface of the sphere. The reflectance measurements were then performed by placing the sample on the sample port, leaving the diffuse reflector B on the reference port. Transmittance measurements were performed with diffuse reflector B positioned on the sample port while the sample itself intercepted the sample beam at its entrance in the sphere. Diffuse reflector B was always used on the reference port.
If rs and ts denote the raw reflectance and transmittance measurements, the absolute reflectance (Rs) and transmittance (Ts) can be approximated with the following formulae:
     (rs - r0).rB.RSR99
Rs = ------------------ [1]
	  1 - r0

     ts.rb.RSR99
Ts = ----------- [2]
       1 - r0
where RSR99 is provided by the certified calibration of the standard. In the transmittance formula, the background r0 is not subtracted, as the fraction of the sample beam not incident on the sample port is part of the signal (being transmitted through the sample). The denominator of the formulae takes into account the effect of r0 on the instrumental full scale value. These correction formulae were tested in various ways.
Grey standard diffusers (reflectance of 80, 60, 40 ,20 ,10, 5 and 2% ) were measured and their corrected reflectance was found to lie within the calibration specifications (standard deviation = ± 0.005). The same was done for a number of colored standard diffusers.
Two diffusing transmittance samples were measured both for reflectance and transmittance (SDM-200-DU and SDM-200-DM). These samples are made of a film (~300 µm) of Spectralon and the sum of their reflectance and transmittance should be very close to 1 (almost negligible absorption).
Since the spectrophotometer does not allow to position the sample horizontally, some material (needles, uncompressed powders) had to be contained in a glass cuvette. The reflectance (Rg) and transmittance (Tg) of the cuvette wall was measured and the reflectance of the studied material (Rs) retrieved using the following formula:
	  Rs+c - Rg
Rs = --------------------- [3]
     Rg.(Rs+c - Rg) + Tg^2
where Rs+c is the corrected (with formula 1) reflectance measurement on the sample in the cuvette. The formula takes into account the multiple reflections. The validity of this correction was checked by measuring a black painted aluminium plate both inside and outside the cuvette. The results are satisfactory. In most of the spectra, a small disturbance can be observed at the 860 nm point due to the automatic change from PbS detector to photomultiplier. In the case of some optically thick samples such as stalks, this disturbance may increase noticeably since the instrument slit width also changes at this point and thus the geometry of the target surface observed may be altered. Technical specifications of the spectrophotometer are given in Table 2 and the configuration of the instrument during the experiment is given in Table 3.
Principle of operation   Double-beam, double-monochromator spectrometer
Spectral range           UV / Vis / NIR (175 - 3200 nm)
Instrument control       External PC (COMPAQ 386 Deskpro)
Optics                   2 monochromators in series, each with 2 gratings
Gratings                 UV / Vis: Holographic grating with 1440 lines/mm
                         NIR: Ruled grating with 360 lines/mm
                         Automatic grating change during monochromator slewing
Filters                  Programmed optical filters with automatic filter change during
                         monochromator slewing
Light sources            UV: Deuterium lamp
                         Vis / NIR: Tungsten-halogen lamp
                         Automatic source change during monochromator slewing
Beam incidence angle     8 degrees
Detectors                UV / Vis: Side window photomultiplier
                         NIR: PbS
                         Automatic detector change during monochromator slewing
Dimensions               845 * 250 * 610 mm
Wavelength accuracy      UV / Vis: +- 0.15 nm
                         NIR: +-0.6 nm
Wavelength repeatability UV / Vis: better than 0.02 nm
                         NIR: better than 0.08 nm
Wavelength resolution    UV / Vis: 0.05 to 5.0 nm
                         NIR: 0.2 to 20 nm
Stray radiation          <0.00008% at 220, 340 and 370 nm
                         <0.002% at 1690 nm
Photometric accuracy     +- 0.08% T at 1A
                         +- 0.05% T at 0.05A
Baseline flatness        UV / Vis: +- 0.001 A
                         NIR: +- 0.002 A
Scan speed               0.9 - 960 nm/min
Integrating sphere       BaSO4 coating
|
| Table 2. Technical specifications of the Perkin Elmer Lambda 19 spectrophotometer |
Ordinate limits / mode 0 - 100 / reflectance Abscissa range (170 - 3200 nm) 400 - 2500 nm Data interval (0.01 - 100 nm) 1.00 nm Slit width UV/Vis (0.05 - 5 nm) 2.00 nm (fixed) NIR servo (1-8) 3 Lamps D2 off / Tungsten (W) on Detector Auto (detector change at 860.8 nm) Instrument speed 480 nm/min Smoothing 2 nm Cycles / Time 1 / Auto |
| Table 3. Configuration of the Perkin Elmer Lambda 19 spectrophotometer during LOPEX'93 |
In parallel with the spectral measurements, many physical and biological measurements were performed on the samples. Leaf blade thickness was measured with a calliper rule (5 measurements per leaf). The fresh weight of a 4.10 cm² disk taken on each leaf using a cork borer was then immediately measured. The disk was then placed in a drying oven at 85°C for 48 hours and reweighed to determine the water content (WC = water mass over fresh mass), the equivalent water thickness or water depth (EWT = water mass per unit leaf area), and the specific leaf area (SLA = dry weight per unit leaf area). Special attention has been paid to the measurement of SLA because biochemical concentrations used in leaf optical properties models are generally expressed in weights per unit leaf area; in this way, we will be able in the future to compare outputs from models with outputs from statistical relationships.
With regard to the other biochemical constituents, about 250 g of fresh material were partially dried in an oven and then sent to two independent and specialized laboratories in France and Belgium which performed the measurements of total proteins, cellulose, lignin, and starch using standard wet chemical analyses. The comparison between the concentration values (g/g) provided by the two laboratories gives an idea of the precision of these analyses: protein and cellulose measurements were quite consistent while lignin and starch measurements differed significantly. These discrepancies are probably mainly due to the different methods of chemical extraction.
Extraction methods:
A total of 120 samples was sent to each laboratory in 2 batches. The first batch, collected in July, contained 70 samples and the second batch, collected in September, contained 50 samples. Each batch contained a number of double samples which allows an estimation to be made of the repeatability of the chemical analyses. Furthermore, some of the vegetation types contained in batch 1 were repeated in batch 2 in order to be able to assess the natural variation of the biochemical concentrations during the period of maximum phenological activity of the vegetation.
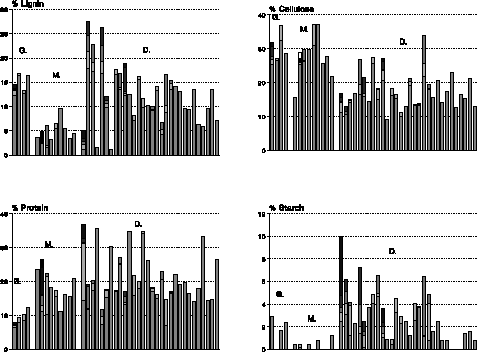
Figure 2 shows the distribution of chemistry data for 10 Gymnosperm, 15 Monocotyledon, and 48 Dicotyledon samples representing the 50 species: the lignin concentration of needles and Dicotyledon leaves which mainly correspond to woody plants respectively amounts to about 14.3% and 12.1% of the dry weight while that of Monocotyledon leaves is three times lower (4.3%). The distribution is rather different for cellulose: its concentration in needles and Monocotyledons respectively amounts to 29.5% and 28.3% while that in Dicotyledons is 10% lower. Lignin and cellulose are structural components of cell walls: they constitute altogether around 30.8% of the dry weight of plant leaves and 43.8% of the dry weight of needles, but they are physiologically and biochemically inactive. In contrast, the concentration of protein which has essential roles in biochemical and physiological processes is twice as high as in plant leaves (19.4%) than in needles (8.5%). The C/N ratio which indicates changes in decomposition rates affecting nutrient cycling and trace gas fluxes consequently varies from 1 to 3. Finally, the starch concentration is very small except for Dicotyledons where it equals 2.5% of the dry weight.
Part of the remaining leaf samples was frozen for later biochemical analysis: the photometric determination of photosynthetic pigments (chlorophyll a, b and total carotenoids) was performed with a UV-2001 PC spectrophotometer in 100% acetone using the equations of Lichtenthaler (1987) at the University of Karlsruhe (Botanical Institute II).
Chlorophyll a: [chl a] = 11.24*A661.6 - 2.04*A644.8
Chlorophyll b: [chl b] = 20.13*A644.8 - 4.19*A661.6
Total chlorophylls: [chl a] = 7.05*A661.6 + 18.09*A644.8
Total carotenoids: [x+c] = (1000*A470 - 1.9*[Chl a] - 63.14 [Chl
b]) / 214
where A = absorption coefficient. Another part of the remaining samples was ground to a fine powder using a Retsch ZM1 grinder equipped with a 10 microns filter. Part of the powders was then compressed under a pressure of 20 tons and formed into pastilles in aluminium and plastic cups (diameter = 30 mm). The pastilles were then dried in an oven for one week at 40°C before their spectral characteristics were measured again in the Lambda 19 spectrophotometer. Each spectral measurement was made on three different points of the pastille. In all, 94 pastilles were measured in this way. (See data files OPEX2---).
A small part of the powders (8 g) was put aside for analysis of the elemental composition of the samples. The elemental analyses were made at the bioclimatology laboratory of INRA Clermont Ferrand (France) using a microanalyser ERBA. The elements of interest were Carbon (C), Hydrogen (H), Nitrogen (N), and Oxygen (O). The elements were not analysed simultaneously. The composition in C, H, and N was estimated using the Dumas and Pregl method. Samples and standards are weighted into tin containers and sealed. The sample is dropped into the combustion furnace. A fixed volume of oxygen is flushed in by the heluim gas carrier. The tin oxydizes immediately and temperature rises to 1800°C. Combustion gases pass on a first catalyst (CR2O3) to produce CO2, H2, SO2 / SO3 and NOx and on a second catalyst (pure copper) to reduce NOx, sulphur and residual oxygen. Gases are then separated in a chromatographic column and quantified using a thermal conductivity detector. The composition in oxygen was determined using the Unterzaucher method. The method is similar to the Dumas and Pregl method except that the catalyst is nickel and combustion gases are transformed in NO. Similary, gases are separated in a chromatographic column and quantified in the same way. Results are expressed in % of dry matter. Two or three repetitions were made for each sample analysis.
The experimental results have been classified and archived for future use in a series of ASCII files in the main directory LOPEX93. The overall structure of the classification system is shown in Figure 1.
The bulk of the data files is constituted by the reflectance and transmittance spectra. A total of 1938 files has been generated with the root name OPEX contained in the sub-directory spectra. Each file has been radiometrically corrected and is expressed in terms of absolute reflectance (as a fraction of 1). The corresponding wavelengths which are identical for all spectra are contained in the file OPEX.WVL and are expressed in nanometres (integer values ranging from 400 to 2500). Examples of reflectance spectra are shown in Figures 2 and 3.
All auxiliary measurements are contained in a separate sub-directory (auxmeas). The complete list of samples is given in Latin (where possible) and English in Tables 1 and 2 respectively. These names are also contained in the files SAM_LNAM and SAM_ENAM.LST.
A key element in this classification is the association between the spectrum number and the relative auxiliary measurements. This is the file SPEC_AUX.DAT. An explanation of the code employed in this file is given in Table 4.
[1] = Spectrum number: 0001 - 2307
[2] = Spectrum type: 1 = reflectance 2 = transmittance
[3] = State of sample: 0 = fresh 1 = dry
[4] = Type of sample: 1 = single leaf
                      2 = stack of leaves (eg. 50 leaves)
                      3 = material in quartz cuvette (eg. needles)
                      4 = stalks
                      5 = optically dense material (eg. bark)
                      6 = pastilles (compressed powder)
[5] = Spectrum block number: 001 - 103
[6] = Average leaf thickness (micron) or average of averages in the case of leaf stacks
[7] = Fresh weight (grammes)
[8] = Dry weight (grammes)
[9] = Leaf area used in weighing (cm2)

-1 = Measurement not made or not applicable

Extract from data file: SPEC_AUX.DAT
____________________________________

0400 1 1 1 004 208.0  -1.0000  -1.0000  -1.00
0401 2 1 1 004 208.0  -1.0000  -1.0000  -1.00
0402 1 1 2 004 208.0  -1.0000  -1.0000  -1.00
0403 1 0 5 033  -1.0   8.5752   6.8440  -1.00
0404 1 0 5 033  -1.0   8.5752   6.8440  -1.00
0405 1 0 5 033  -1.0   8.5752   6.8440  -1.00
0406 1 0 5 033  -1.0   8.5752   6.8440  -1.00
0407 1 0 5 033  -1.0   8.5752   6.8440  -1.00
0410 1 0 1 034 122.0   0.0429   0.0147   4.10
0411 2 0 1 034 122.0   0.0429   0.0147   4.10
0412 1 0 1 034 118.0   0.0397   0.0119   4.10
0413 2 0 1 034 118.0   0.0397   0.0119   4.10
0414 1 0 1 034 134.0   0.0480   0.0157   4.10
0415 2 0 1 034 134.0   0.0480   0.0157   4.10
0416 1 0 1 034  82.0   0.0315   0.0079   4.10
0417 2 0 1 034  82.0   0.0315   0.0079   4.10
0418 1 0 1 034 134.0   0.0394   0.0149   4.10
0419 2 0 1 034 134.0   0.0394   0.0149   4.10
0420 1 0 2 034 118.0   0.4263   0.1223   4.10
0421 1 1 1 002  72.0  -1.0000  -1.0000  -1.00
0422 2 1 1 002  72.0  -1.0000  -1.0000  -1.00
0423 1 1 1 002  90.0  -1.0000  -1.0000  -1.00
|
| Table 4. Explanation of code used in Spec. / Aux. meas. file (SPEC_AUX.DAT) |
The association between the sample number and the relative biochemical analyses is contained in the file SAM_BIO.DAT. This file also contains the code indicating the type of sample in question (ie. monocotyledon, dicotyledon etc). An explanation of the code employed is given in Table 5.
[1] = sample number (001-120) [2] = type of sample: 1 Monocotyledon 2 Dicotyledon 3 Gymnosperm 0 Other [3] = sample status: 1 Single sample 2 Double sample (first occurence) 3 Triple sample (first occurence) [4] = associated spectrum block number (SPEC_AUX.DAT) [5] = Nitrogen % dry weight ( France) [6] = Nitrogen % dry weight (Belgium) [7] = Cellulose % dry weight (France) [8] = Cellulose % dry weight (Belgium) [9] = Lignin % dry weight (France) [10] = Lignin % dry weight (Belgium) [11] = Starch % dry weight (France) [12] = Starch % dry weight (Belgium) -1.00 = No analysis or not applicable Extract from SAM_BIO.DAT ________________________ 001 2 1 026 31.69 31.35 12.10 15.78 3.04 2.16 0.00 2.43 002 1 1 015 24.21 23.69 24.90 30.01 3.45 3.58 0.00 0.40 003 3 1 009 6.26 7.11 25.20 25.49 12.51 12.29 0.00 2.95 004 2 1 038 10.89 11.86 9.10 11.55 4.28 21.29 9.25 5.13 005 2 1 029 20.64 20.41 11.10 14.79 9.25 22.80 0.35 3.89 006 2 1 024 35.52 35.58 12.40 16.82 3.93 1.60 2.74 2.25 007 3 1 012 7.63 7.94 23.50 27.13 10.68 16.44 0.00 0.00 008 2 1 006 7.37 7.42 14.30 16.66 11.92 22.53 0.00 7.28 009 3 1 010 6.06 7.28 25.10 26.76 12.35 14.46 0.00 0.00 010 2 1 019 18.19 17.69 13.90 15.98 9.82 11.34 0.00 1.61 011 2 1 014 33.05 32.66 2.10 11.34 2.68 3.43 3.02 9.99 012 1 1 013 25.31 26.55 21.80 26.60 2.19 3.03 9.42 0.40 013 2 1 032 31.93 30.33 11.00 14.50 2.62 1.09 1.43 3.66 014 2 2 038 13.70 11.96 8.69 10.61 3.49 17.82 8.67 6.17 015 2 2 029 20.66 19.43 11.50 14.98 6.92 19.12 0.94 4.11 016 1 1 039 25.65 24.09 22.60 25.89 2.39 2.75 0.34 0.00 017 3 1 011 7.90 8.58 29.80 32.51 11.34 13.31 0.00 1.63 018 0 1 042 41.07 40.83 10.90 14.15 10.32 6.82 2.17 6.00 019 2 1 005 9.13 9.83 16.80 19.40 13.17 26.22 3.38 4.01 020 2 1 031 16.99 17.01 22.60 25.56 15.56 16.59 0.70 4.86 021 2 1 006 10.48 11.82 21.90 26.81 20.09 16.80 6.73 2.03 022 2 1 002 25.86 25.13 15.30 18.27 17.36 16.73 2.34 6.52 023 2 1 001 17.02 16.17 23.20 26.29 23.31 18.13 0.12 3.64 |
| Table 5. Explanation of code used in Sample / Biochemical file (SAM_BIO.DAT) |
The association between the sample number and the relative spectra is contained in the file SAM_SPEC.DAT. An explanation of the code employed in this file is given in Table 6.
    [1] = sample number (001 - 120)
  [2-6] = reflectance spectrum number of fresh single leaf (eg. OPEX0306)
 [7-11] = transmittance spectrum number of fresh single leaf (eg. OPEX0307)
   [12] = reflectance spectrum number of fresh leaf stack (eg. OPEX0316)
[13-17] = reflectance spectrum number of fresh optically thick material
[18-22] = reflectance spectrum number of dry single leaf (eg. OPEX0489)
[23-27] = transmittance spectrum number of dry single leaf (eg. OPEX490)
   [28] = reflectance spectrum number of dry leaf stack (eg. OPEX0499)
[29-33] = reflectance spectrum number of dry optically thick material
[34-36] = reflectance spectrum number of pastilles (eg. OPEX2005)

-1 = measurement not made or not applicable

Extract from SAM_SPEC.DAT
_________________________

001 0306 0308 0310 0312 0314 0307 0309 0311 0313 0315 0316   -1   -1   -1   -1   -1   -1   -1   -1   -1   -1   -1   -1   -1   -1   -1   -1   -1   -1   -1   -1   -1 2003 2004 2005
002 0163 0165 0167 0169 0171 0164 0166 0168 0170 0172 0173   -1   -1   -1   -1   -1   -1   -1   -1   -1   -1   -1   -1   -1   -1   -1   -1   -1   -1   -1   -1   -1 2006 2007 2008
003   -1   -1   -1   -1   -1   -1   -1   -1   -1   -1   -1 0111 0112 0113 0114 0115   -1   -1   -1   -1   -1   -1   -1   -1   -1   -1   -1 0437 0438 0439 0440 0441   -1   -1   -1
004 0522 0524 0526 0528 0530 0523 0525 0527 0529 0531 0532   -1   -1   -1   -1   -1 0768 0770 0772 0774 0776 0769 0771 0773 0775 0777 0778   -1   -1   -1   -1   -1 2013 2014 2015
005 0335 0337 0339 0341 0343 0336 0338 0340 0342 0344 0345   -1   -1   -1   -1   -1   -1   -1   -1   -1   -1   -1   -1   -1   -1   -1   -1   -1   -1   -1   -1   -1 2016 2017 2018
006 0288 0290 0292 0294 0296 0289 0291 0293 0295 0297 0298   -1   -1   -1   -1   -1 0489 0491 0493 0495 0497 0490 0492 0494 0496 0498 0499   -1   -1   -1   -1   -1   -1   -1   -1
007   -1   -1   -1   -1   -1   -1   -1   -1   -1   -1   -1 0134 0135 0136 0137 0138   -1   -1   -1   -1   -1   -1   -1   -1   -1   -1   -1 0745 0746 0747 0748 0749 2019 2020 2021
008 0073 0075 0077 0079 0081 0074 0076 0078 0080 0082 0084   -1   -1   -1   -1   -1 0454 0456 0458 0460 0462 0455 0457 0459 0461 0463 0464   -1   -1   -1   -1   -1 2022 2023 2024
009   -1   -1   -1   -1   -1   -1   -1   -1   -1   -1   -1 0117 0118 0119 0120 0121   -1   -1   -1   -1   -1   -1   -1   -1   -1   -1   -1 0442 0443 0444 0445 0446 2025 2026 2027

Note: Special case is sample no.56 (plane bark)
        [2-6] = reflectance of inner side of fresh bark
      [13-17] = reflectance of outer side of fresh bark
      [29-33] = reflectance of outer side of dry bark
|
| Table 6. Explanation of code used in Sample / Spectrum file (SAM_SPEC.DAT) |
The association between the sample number and the spectrum number can thus be obtained in 2 ways: (1) Indirectly, by means of the spectrum block number in the SAM_BIO and SPEC_AUX files. (2) Directly, by means of the SAM_SPEC.DAT file The results of the chlorophyll and total carotenoids analyses can be found in the file SAM_PIG.DAT. An explanation of the code employed in this file is given in Table 7.
    [1] = sample number
    [2] = type of sample: 1 fresh leaf (flmr / flmt / flmri --> 66 spectra)
                          2 dry leaf (dlmr / dlmt / dlmri --> 60 spectra)
                          3 fresh needle (fnmr --> 10 spectra)
                          4 dry needle (dnmr --> 10 spectra)
                          5 fresh stalk (fsmr --> 12 spectra)
                          6 dry stalk (dsmr --> 7 spectra)
                          7 powder (pwmr --> 11 spectra)
    [3] = type of plant: 1 Monocotyledon
                         2 Dicotyledon
                         3 Gymnosperm
  [4-5] = Chlorophyll a content per fresh weight (mg/g)
    [6] = average value
  [7-8] = Chlorophyll b content per fresh weight (mg/g)
    [9] = average value
[10-11] = Carotenoids content per fresh weight (mg/g)
   [12] = average value
[13-14] = Chlorophyll a content per dry weight (mg/g)
   [15] = average value
[16-17] = Chlorophyll b content per dry weight (mg/g)
   [18] = average value
[19-20] = Carotenoids content per dry weight (mg/g)
   [21] = average value

-1 = measurement not made or not applicable

Extract from SAM_PIG.DAT
________________________

001 1  1 2  2.61   2.97   2.79   0.94   1.00   0.97   0.51   0.56   0.54 10.01  11.40  10.71   3.61   3.86   3.74   1.94   2.15   2.05
002 1  2 1  2.42   2.32   2.37   0.55   0.52   0.54   0.68   0.69   0.69  9.59   9.20   9.40   2.19   2.05   2.12   2.72   2.74   2.73
003 3  1 3  0.67   0.64   0.66   0.27   0.23   0.25   0.22   0.21   0.22  0.82   0.77   0.80   0.32   0.29   0.31   0.26   0.25   0.26
003 4  1 3    -1     -1     -1     -1     -1     -1     -1     -1     -1    -1     -1     -1     -1     -1     -1     -1     -1     -1
004 1  3 2  0.88   0.89   0.89   0.24   0.25   0.25   0.34   0.35   0.35  2.95   2.97   2.96   0.81   0.84   0.83   1.14   1.16   1.15
004 2  1 2  1.34   1.41   1.38   0.22   0.18   0.20   0.19   0.21   0.20  3.67   3.87   3.77   0.61   0.48   0.54   0.53   0.58   0.55
005 1  4 2  3.35   3.31   3.33   1.05   1.03   1.04   0.83   0.83   0.83  8.72   8.61   8.66   2.74   2.69   2.72   2.16   2.15   2.16
006 1  5 2  1.17   1.02   1.10   0.40   0.36   0.38   0.36   0.31   0.34 11.50  10.04  10.77   3.92   3.54   3.73   3.51   3.05   3.28
006 2  2 2  3.12   3.20   3.16   0.44   0.40   0.42   0.35   0.37   0.36  3.47   3.56   3.52   0.48   0.45   0.47   0.39   0.41   0.40
|
| Table 7. Explanation of code used in Sample / Pigments file (SAM_PIG.DAT) |
The results of the elemental analyses can be found in the file SAM_ELE.DAT. An explanation of the code employed in this file is given in Table 7.
    [1] = sample number
  [2-4] = Carbon (% dry matter)
    [5] = Carbon (average value)
  [6-8] = Hydrogen (% dry matter)
    [9] = Hydrogen (average value)
[10-12] = Oxygen (% dry matter)
   [13] = Oxygen (average value)
[14-16] = Nitrogen (% dry matter)
   [17] = Nitrogen (average value)

-1 = measurement not made or not applicable

Extract from SAM_ELE.DAT
________________________

001   46.30  46.96  -1.00  46.63  6.13  6.23 -1.00  6.18  36.82  37.96  -1.00  37.39  5.22  5.06 -1.00  5.14
002   47.32  46.50  47.26  47.03  6.19  6.13  6.63  6.31  36.76  40.71  39.57  39.02  3.32  3.30  3.30  3.31
003   -1.00  -1.00  -1.00  -1.00 -1.00 -1.00 -1.00 -1.00  1.00  -1.00  -1.00  -1.00 -1.00 -1.00 -1.00 -1.00
004   46.14  45.82  46.02  45.99  5.56  5.85  5.56  5.65  44.09  43.68  -1.00  43.88  2.00  1.87 -1.00  1.94
005   45.82  46.08  45.95  45.96  5.94 -1.00 -1.00  5.95  37.83  39.83  39.30  38.99  3.32  3.16 -1.00  3.24
006   -1.00  -1.00  -1.00  -1.00 -1.00 -1.00 -1.00 -1.00  -1.00  -1.00  -1.00  -1.00 -1.00 -1.00 -1.00 -1.00
007   50.46  50.73  50.57  50.59  6.61  6.83  7.04  6.83  40.60  41.28  -1.00  40.94  1.43  1.22  1.10  1.25
008   49.07  48.67  47.75  48.50  6.26  6.23  5.99  6.16  39.66  40.32  -1.00  39.99  1.41  1.17 -1.00  1.29
009   51.93  51.83  51.76  51.84  7.51  7.53  7.00  7.35  38.91  40.92  39.34  39.72  1.66  1.28 -1.00  1.47
010   47.32  46.77  47.01  47.03  6.93  6.89  5.69  6.50  38.54  37.02  -1.00  37.78  2.94  2.72 -1.00  2.83
011   46.21  46.86  46.96  46.68  6.13  6.43 -1.00  6.28  36.52  37.33  -1.00  36.93  5.09  5.26  5.11  5.15
012   46.96  47.06  47.08  47.03  7.35  6.43  6.11  6.63  37.32  37.66  -1.00  37.49  4.31  4.41 -1.00  4.36
013   42.82  43.66  43.83  43.44  5.68  5.26  5.89  5.61  37.53  39.03  -1.00  38.28  4.88  4.98 -1.00  4.93
014   -1.00  -1.00  -1.00  -1.00 -1.00 -1.00 -1.00 -1.00  -1.00  -1.00  -1.00  -1.00 -1.00 -1.00 -1.00 -1.00
015   -1.00  -1.00  -1.00  -1.00 -1.00 -1.00 -1.00 -1.00  -1.00  -1.00  -1.00  -1.00 -1.00 -1.00 -1.00 -1.00
016   46.22  46.78  45.97  46.32  7.18  5.84  6.00  6.34  38.37  38.31  -1.00  38.34  3.74  3.56 -1.00  3.65
017   50.20  50.06  49.49  49.92  7.89  6.14  6.74  6.92  42.21  42.93  -1.00  42.57  1.27  1.51 -1.00  1.39
|
| Table 8. Explanation of code used in Sample / Elements file (SAM_ELE.DAT) |
An important and valuable data set has been put together with these measurements. The preparation of the leaf samples was particularly time-consuming especially in the case of plants with small leaves. The spectral measurements were made with the best equipment available and can be considered to be very precise. The fact that the samples were also powdered and compressed means that they will also be available in the future for further measurements or comparison. Preliminary analyses of the data show many promising results but there are many other analyses of correlation which still remain to be made at the time of writing. The authors hope that these data can be used by other researchers in this field and that the results will contribute to a better understanding of the relationship between the spectral characteristics of vegetation and its biochemical components for application in Remote Sensing.
The authors are grateful to:
Chemical analyses were conducted by the "Centre de Recherches Agronomiques", Libramont (Belgium), and by "Europe Sols", Toulouse (France).
For more information on the LOPEX measurement campaign, instruments, observational protocols, etc, please contact:
Mr. Brian Hosgood
European Commission / Joint Research Centre
Institute for the Protection and Security of the Citizen
Sensors, Radar Technologies and Cybersecurity Unit
21020 Ispra (Va) Italy
Fax: +39 0332 785469
Email: brian.hosgood@jrc.it